A better way of visualizing Kubernetes events

Dear Friend,
I came across this tweet and I couldn't resist to look more into it:
Would you like your Kubernetes Events to look like this?
— Bryan Boreham (@bboreham) March 18, 2021
I made a thing called "kspan" that turns Events into OpenTelemetry spans. Code at https://t.co/G79BkautJ3 (very much a work in progress).
KubeCon talk May 7th: https://t.co/mHeqniWISd pic.twitter.com/p0aYdWKOzJ
One of the things you first commands you learn when working with Kubernetes is the kubectl describe command. You can get a lot of information from a Pod, for instance:
$ kubectl describe pod nginx-deployment-1006230814-6winp

Name:		nginx-deployment-1006230814-6winp
Namespace:	default
Node:		kubernetes-node-wul5/10.240.0.9
Start Time:	Thu, 24 Mar 2016 01:39:49 +0000
Labels:		app=nginx,pod-template-hash=1006230814
Annotations:    kubernetes.io/created-by={"kind":"SerializedReference","apiVersion":"v1","reference":{"kind":"ReplicaSet","namespace":"default","name":"nginx-deployment-1956810328","uid":"14e607e7-8ba1-11e7-b5cb-fa16" ...
Status:		Running
IP:		10.244.0.6
Controllers:	ReplicaSet/nginx-deployment-1006230814
Containers:
  nginx:
    Container ID:	docker://90315cc9f513c724e9957a4788d3e625a078de84750f244a40f97ae355eb1149
    Image:		nginx
    Image ID:		docker://6f62f48c4e55d700cf3eb1b5e33fa051802986b77b874cc351cce539e5163707
    Port:		80/TCP
    QoS Tier:
      cpu:	Guaranteed
      memory:	Guaranteed
    Limits:
      cpu:	500m
      memory:	128Mi
    Requests:
      memory:		128Mi
      cpu:		500m
    State:		Running
      Started:		Thu, 24 Mar 2016 01:39:51 +0000
    Ready:		True
    Restart Count:	0
    Environment:        <none>
    Mounts:
      /var/run/secrets/kubernetes.io/serviceaccount from default-token-5kdvl (ro)
Conditions:
  Type          Status
  Initialized   True
  Ready         True
  PodScheduled  True
Volumes:
  default-token-4bcbi:
    Type:	Secret (a volume populated by a Secret)
    SecretName:	default-token-4bcbi
    Optional:   false
QoS Class:      Guaranteed
Node-Selectors: <none>
Tolerations:    <none>
Events:
  FirstSeen	LastSeen	Count	From					SubobjectPath		Type		Reason		Message
  ---------	--------	-----	----					-------------		--------	------		-------
  54s		54s		1	{default-scheduler }						Normal		Scheduled	Successfully assigned nginx-deployment-1006230814-6winp to kubernetes-node-wul5
  54s		54s		1	{kubelet kubernetes-node-wul5}	spec.containers{nginx}	Normal		Pulling		pulling image "nginx"
  53s		53s		1	{kubelet kubernetes-node-wul5}	spec.containers{nginx}	Normal		Pulled		Successfully pulled image "nginx"
  53s		53s		1	{kubelet kubernetes-node-wul5}	spec.containers{nginx}	Normal		Created		Created container with docker id 90315cc9f513
  53s		53s
If you pay attention to the last section of the command's result, you will see a Events section.
The way they are presented is a bit peculiar: the system compresses multiple identical events by indicating the first and last time it was seen and the number of times it was seen. So, it's definitely a view that we are not accustom to. I'd rather view the events happening in a chronological manner - just as they happen in time.
Introducing kspan
kspan is a program built in Golang that turns those Events into OpenTelemetry Spans, joining them up by causality and grouping them together into Traces.
It's important to highlight that kspan is, at the time of writing, under work in progress and active evolution - keep up the good work Bryan 👏👏👏
Getting started
First of all, we're going to deploy Jaeger, an open source, end-to-end distributing tracing. Kspan will send tracing data to Jaeger backend.
The Jaeger image we'll be using is composed of an executable designed for quick local testing, launches the Jaeger UI, collector, query, and agent, with an in memory storage component.
apiVersion: apps/v1
kind: Deployment
metadata:
  labels:
    app: jaeger
  name: jaeger
spec:
  replicas: 1
  selector:
    matchLabels:
      app: jaeger
  strategy: {}
  template:
    metadata:
      labels:
        app: jaeger
    spec:
      containers:
      - image: jaegertracing/opentelemetry-all-in-one
        name: opentelemetry-all-in-one
        resources: {}
        ports:
        - containerPort: 16685
        - containerPort: 16686
        - containerPort: 5775
          protocol: UDP
        - containerPort: 6831
          protocol: UDP
        - containerPort: 6832
          protocol: UDP
        - containerPort: 5778
protocol: TCPCreate the Deployment resource with:
$ kubectl apply -f jaeger-deploy.yamlBy default kspan will use otlp-collector.default:55680, so let's expose the Jaeger pod with a ClusterIP service with that name in the default namespace.
apiVersion: v1
kind: Service
metadata:
  labels:
    app: jaeger
  name: otlp-collector
spec:
  ports:
  - port: 55680
    protocol: TCP
    targetPort: 55680
  selector:
app: jaegerCreate the Service resource with:
$ kubectl apply -f jaeger-svc.yamlNext, port-forward the Jaeger UI and access it at http://localhost:16686.
To launch kspan, spin up a Pod in your Kubernetes cluster using the image docker.io/weaveworks/kspan:v0.0
apiVersion: v1
kind: Pod
metadata:
  labels:
    run: kspan
  name: kspan
spec:
  containers:
  - image: docker.io/weaveworks/kspan:v0.0
    name: kspan
    resources: {}
  dnsPolicy: ClusterFirst
restartPolicy: AlwaysCreate the Pod resource with:
$ kubectl apply -f kspan-pod.yamlFinally, let's deploy a workload example like a 1-replica nginx server to later on check the traces in the Jaeger UI:
$ kubectl create deploy nginx --image=nginxJust right after the deployment, you can check the logs of the kspan Pod and you will find log information about traces being sent to Jaeger:
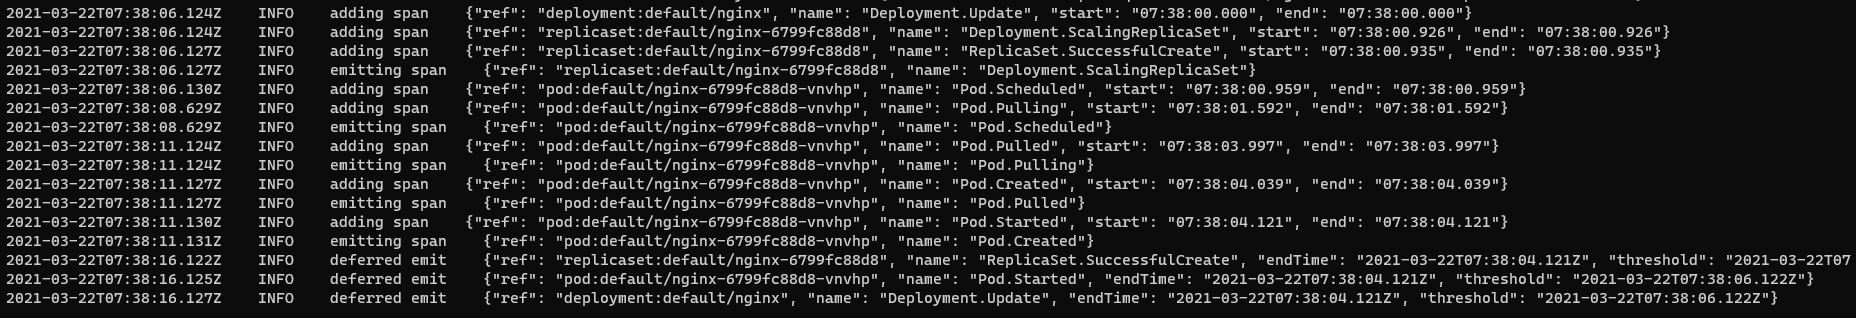
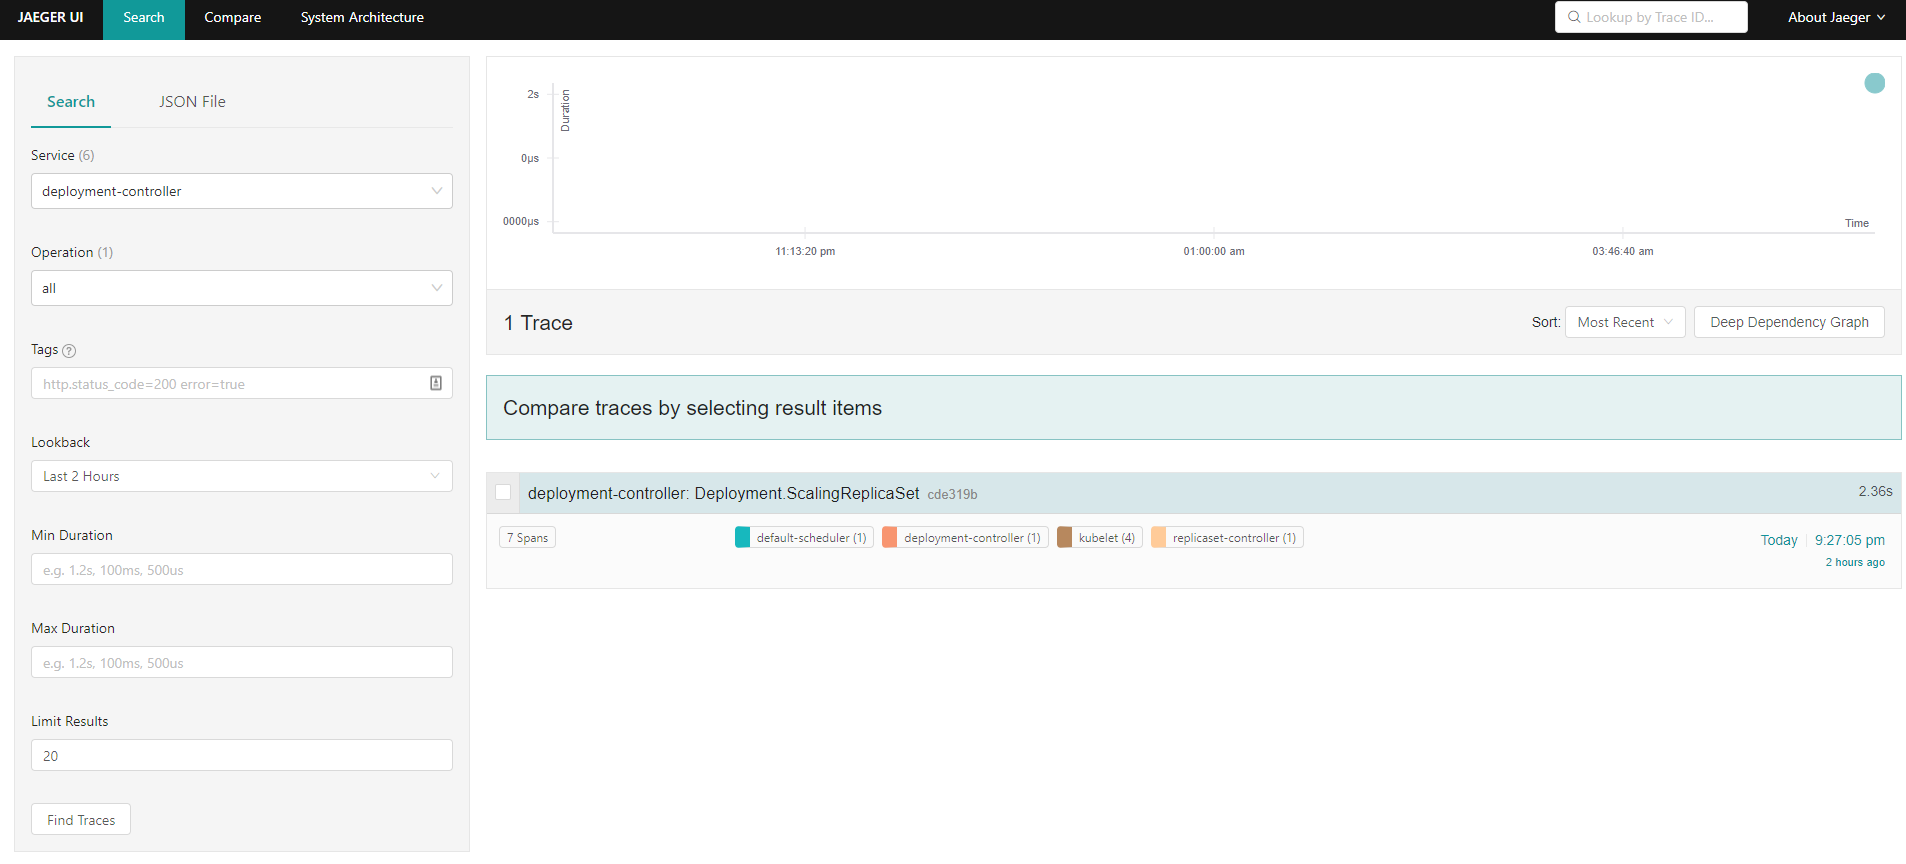
Notice that kspan is emitting those traces to Jaeger in UTC, which means Jaeger will represents the timestamps in UTC time in their UI, so you have to increase the Loopback hours (dropdown) in the left-menu to find traces.
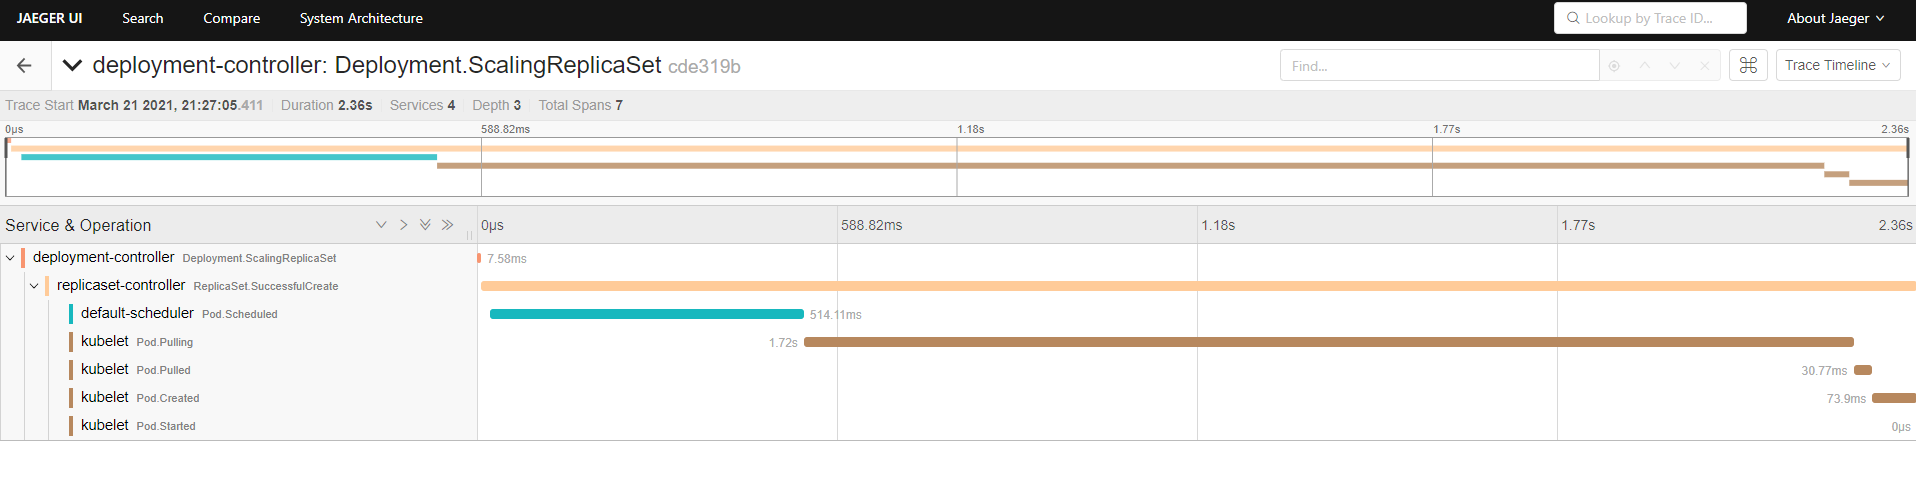
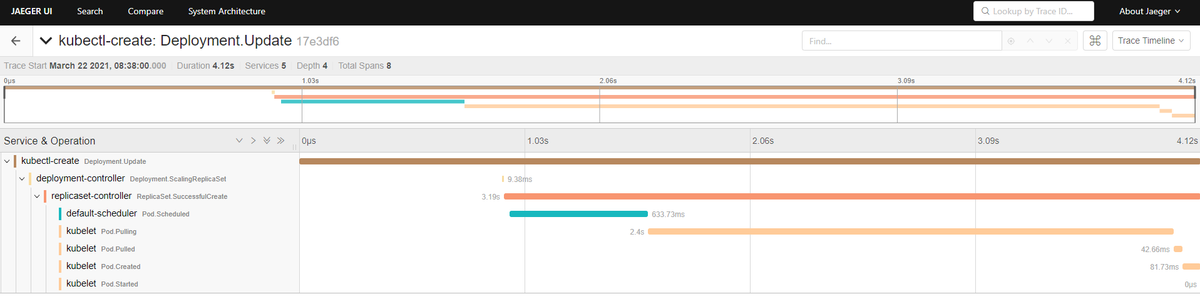
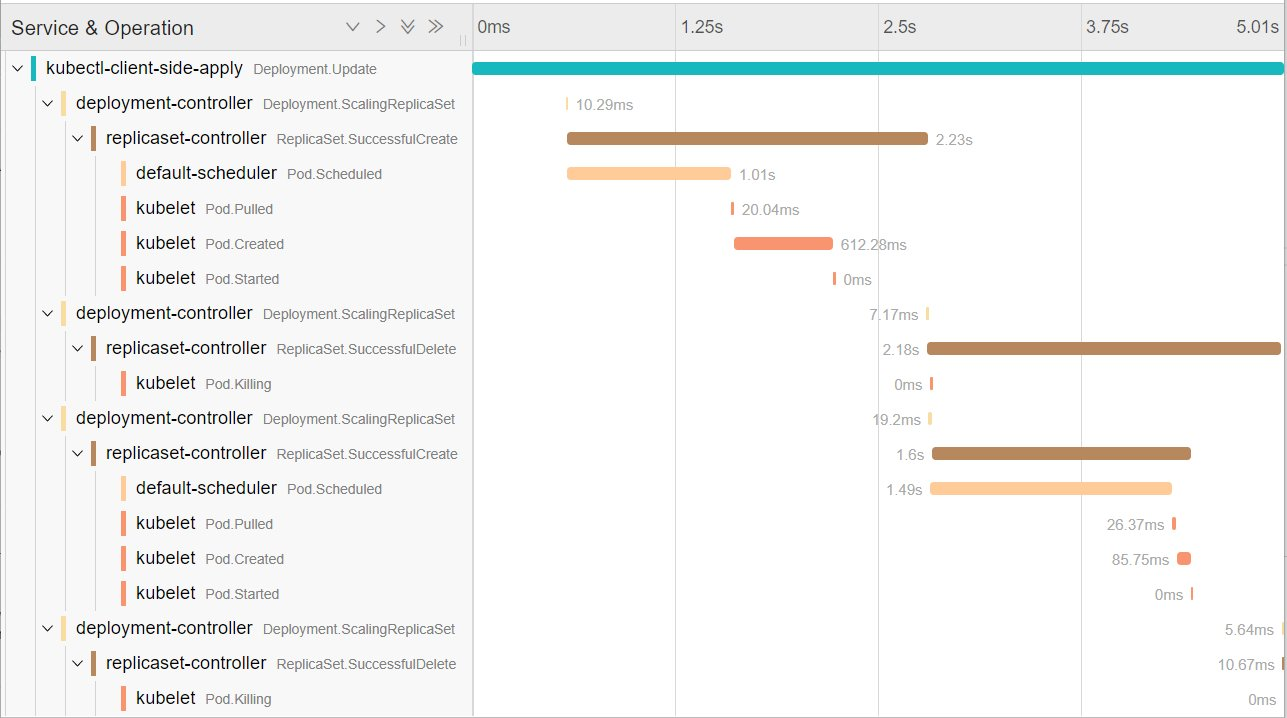
To view more information, click on the trace: